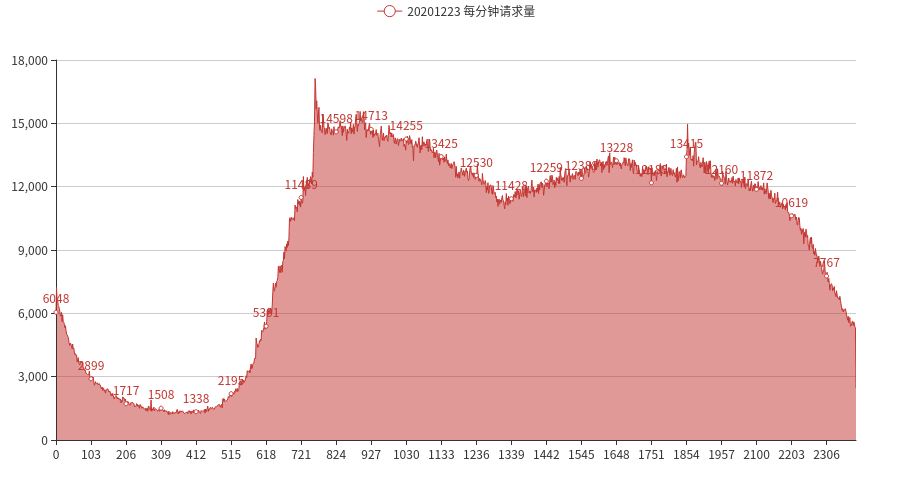
效果图
代码,直接从jupyter notebook导出为md格式 1 2 3 4 5 6 import osimport pandas as pdimport numpy as npimport pyecharts.options as optsfrom pyecharts.charts import Line
1 2 os.system("find . -name 'stat20201223.rec'|xargs grep '\\.'|cut -d '.' -f4,4|cut -c 16-19|sort|uniq -c|sort -n > tmpres1.txt" )
0
1 2 3 4 5 6 7 8 9 10 11 12 13 14 os.system("tail -n 1440 tmpres1.txt > tmpres2.txt" ) xdata,ydata=[],[] with open("tmpres2.txt" ,"r" ) as f: tmp=f.readline().split(" " ) while len(tmp)>1 : ydata.append(int(tmp[-2 ])) xdata.append(int(tmp[-1 ].replace("\n" ,"" ))) tmp=f.readline().split(" " ) df = pd.DataFrame(np.array([xdata,ydata]).T) df=df.sort_values(by=[0 ,1 ],ascending=True ,ignore_index=True ) df[0 ]=df[0 ].astype(str) xd=df[0 ].tolist() yd=df[1 ].tolist()
1 2 3 4 5 6 7 8 9 10 11 12 13 14 15 16 17 c = ( Line(init_opts=opts.InitOpts(width="1000px" )) .add_xaxis(xd) .add_yaxis("20201223 每分钟请求量" , yd, areastyle_opts=opts.AreaStyleOpts(opacity=0.5 )) .set_global_opts( tooltip_opts=opts.TooltipOpts(is_show=False ), yaxis_opts=opts.AxisOpts( type_="value" , axistick_opts=opts.AxisTickOpts(is_show=True ), splitline_opts=opts.SplitLineOpts(is_show=True ), ), xaxis_opts=opts.AxisOpts(type_="category" , boundary_gap=False ), ) .render("line_area_style.html" ) ) c
总结 以后可以更加方便的导出jupyter notebook代码。